
Hosting services in Containers still requires us to log information, ideally in a central logging solution, thats where Elastic, FluendD and Kibana come to help out.
In this post we will have a look exporting logs from our .NET service.
TLDR;
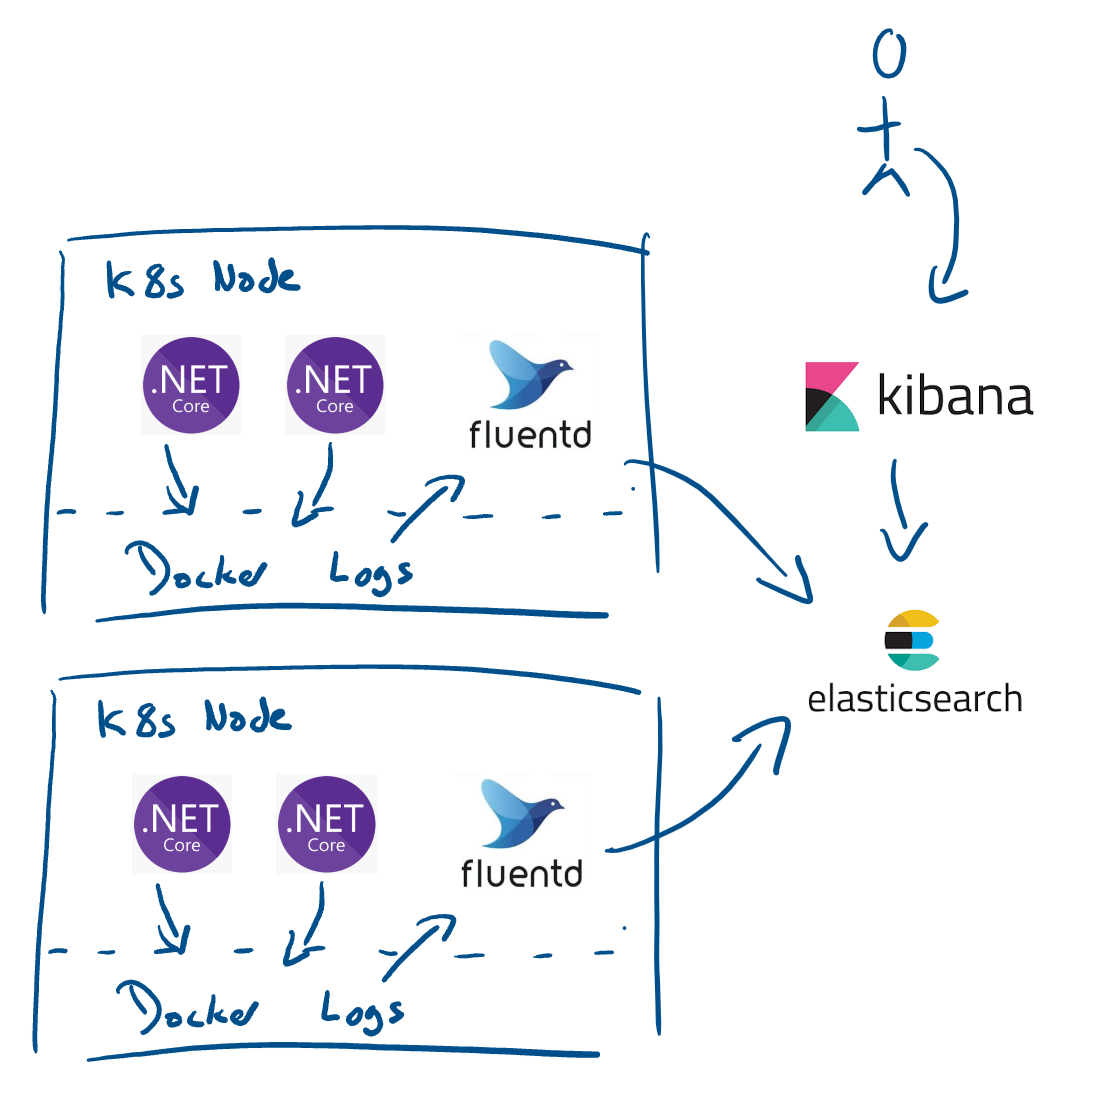
- Serilog exports logs to the Std-IO using the ElasticSearch Json Serializer.
- FluentD reads from all containers Std-IO, parses it, and forwards to Elastic.
- We need to add a filter to the FluentD Configuration, in order for it to process the Json correctly
- We used FluentD over Logstash for a number of reasons.
Background
In most solutions its simple to write the console (standard-out), however we need to capture more than just the logged message, such as:
- the service logging the message
- the log level
- time of the event
- the host/node and also container which the process is running
Wow thats a lot of information.
Todo the above we can use Log-Shippers such as FileBit, LogStash, FluentD etc. These will extract logs in different formats and locations, process them (parse the data into a required format) and then forward them onto other components such as Datadog, ElasticSearch etc
Even though the log-shipper can parse the data in the logs to figure out the level, timestamp, message etc, we will provide it with a simple Json payload to make things easier.
.NET service logging
our service needs to write to the console with a structured json payload, which is actually pretty easy using .NET with Serilog
dotnet add package Serilog.AspNetCore
dotnet add package Serilog.Sinks.Console
dotnet add package Serilog.Sinks.ElasticSearch
These 3 packages allow you add add logging to ASP.NET, write Json to the Standard-out in a compatible format.
follow the how to from Serilog: https://github.com/serilog/serilog-aspnetcore
Then add the 2 lines below when setting up the logger
//this is how you could get the service name.
string serviceName = Assembly.GetEntryAssembly().GetName().Name;

//inside the program main
Log.Logger = new LoggerConfiguration()
        .MinimumLevel.Information()
        .Enrich.FromLogContext()

        //here
        .Enrich.WithProperty("Service", serviceName)
        .WriteTo.Console(new ElasticsearchJsonFormatter());

        .CreateLogger();
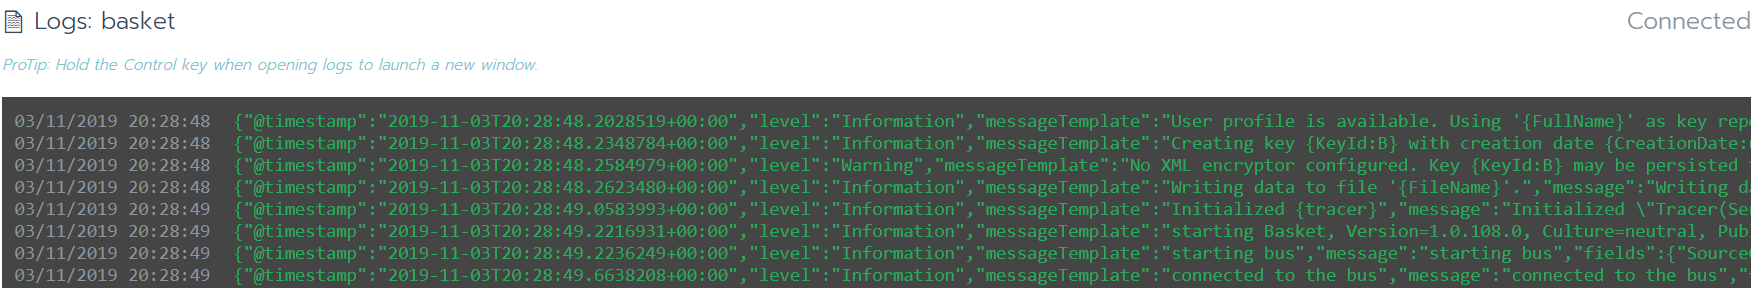
OK our service is ready, when you run it the logs should look like this:
Setting up FluentD
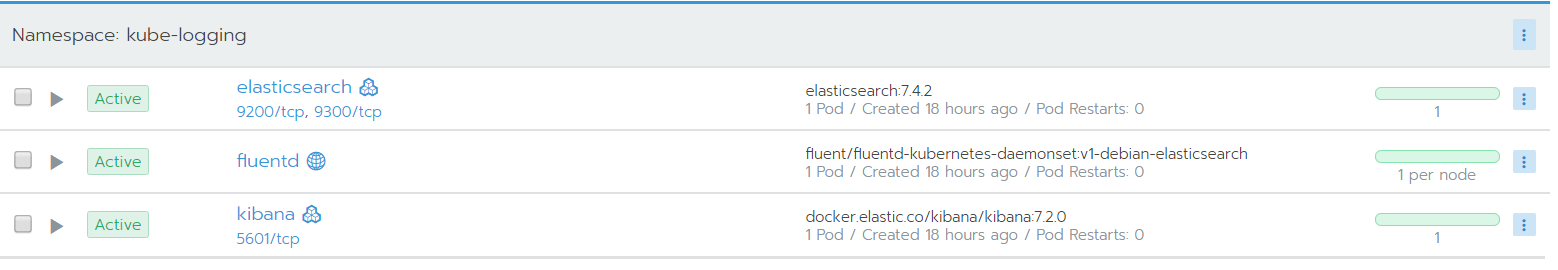
for this we will manually setup FluentD, you can use the helm chart, we will deploy it as a daemon-set (1 per node)
FluentD have provided https://github.com/fluent/fluentd-kubernetes-daemonset which sets up the FluentD to work with Kubernetes and ElasticSearch.
However the default deployment configuration files do not seem to process the output, this Github issue provides the following filter which I needed to apply
https://github.com/fluent/fluentd-kubernetes-daemonset/issues/273
<filter kubernetes.var.log.containers.**>
  @type parser
  format json
  key_name log
  reserve_time true
  reserve_data true
  emit_invalid_record_to_error false
</filter>
I appended it to the kubernetes.conf, found here: https://gist.github.com/dbones/134f845951a1877c902e562e23013c3b#file-configmap-yaml-L234
To apply a volume with the new configuration, we also need to run FluendD with the following Environment Variable
- name: FLUENT_ELASTICSEARCH_SED_DISABLE
    value: "true"
found here: https://gist.github.com/dbones/134f845951a1877c902e562e23013c3b#file-deployment-yaml-L27
In this case, im running a single node setup
In Kibana
Once you have run this and start to ship logs to Elastic, you will/may need to refresh the index, so Kibana will allow you to add our fields as columns
The above should now provide the following data in an entry.
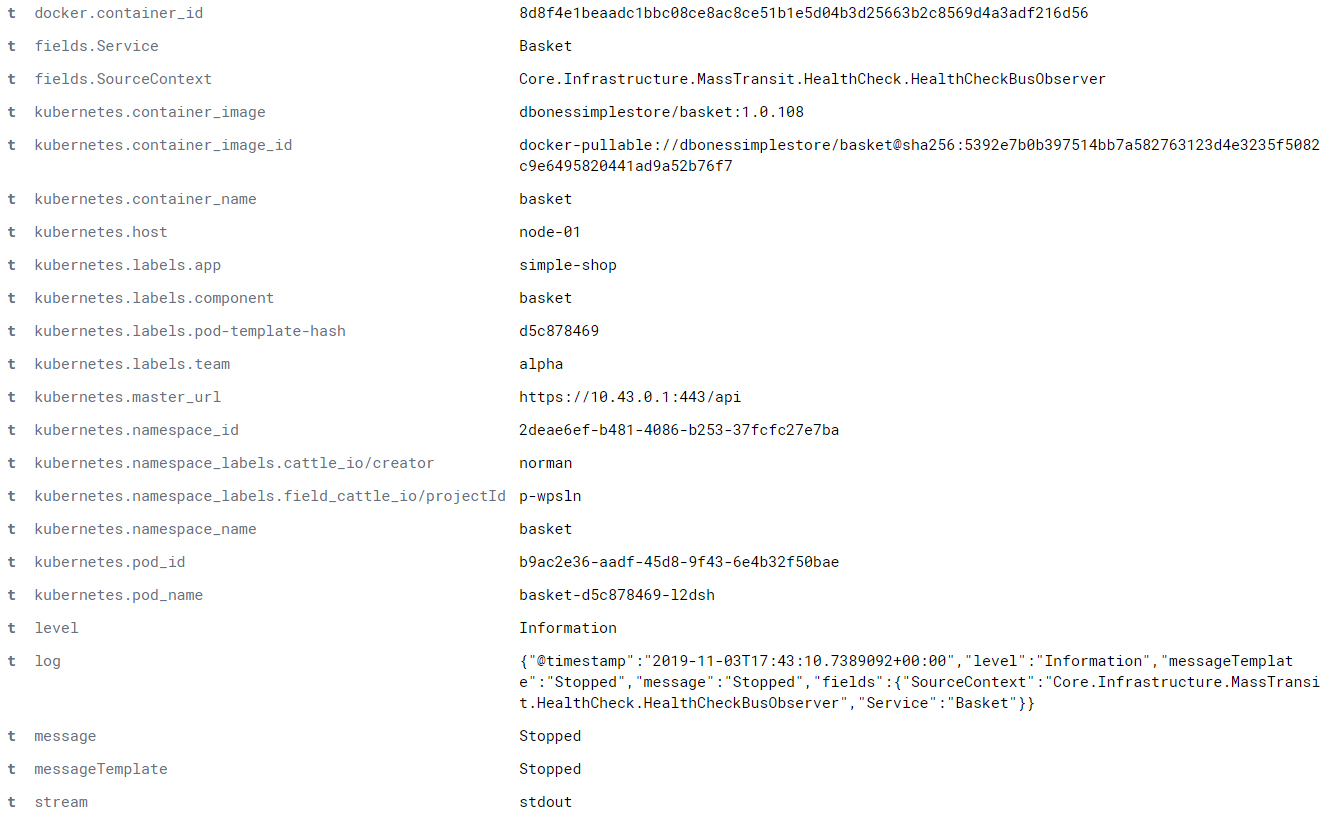
we can add some K8s labels and now provide a really helpful columns to filter on.
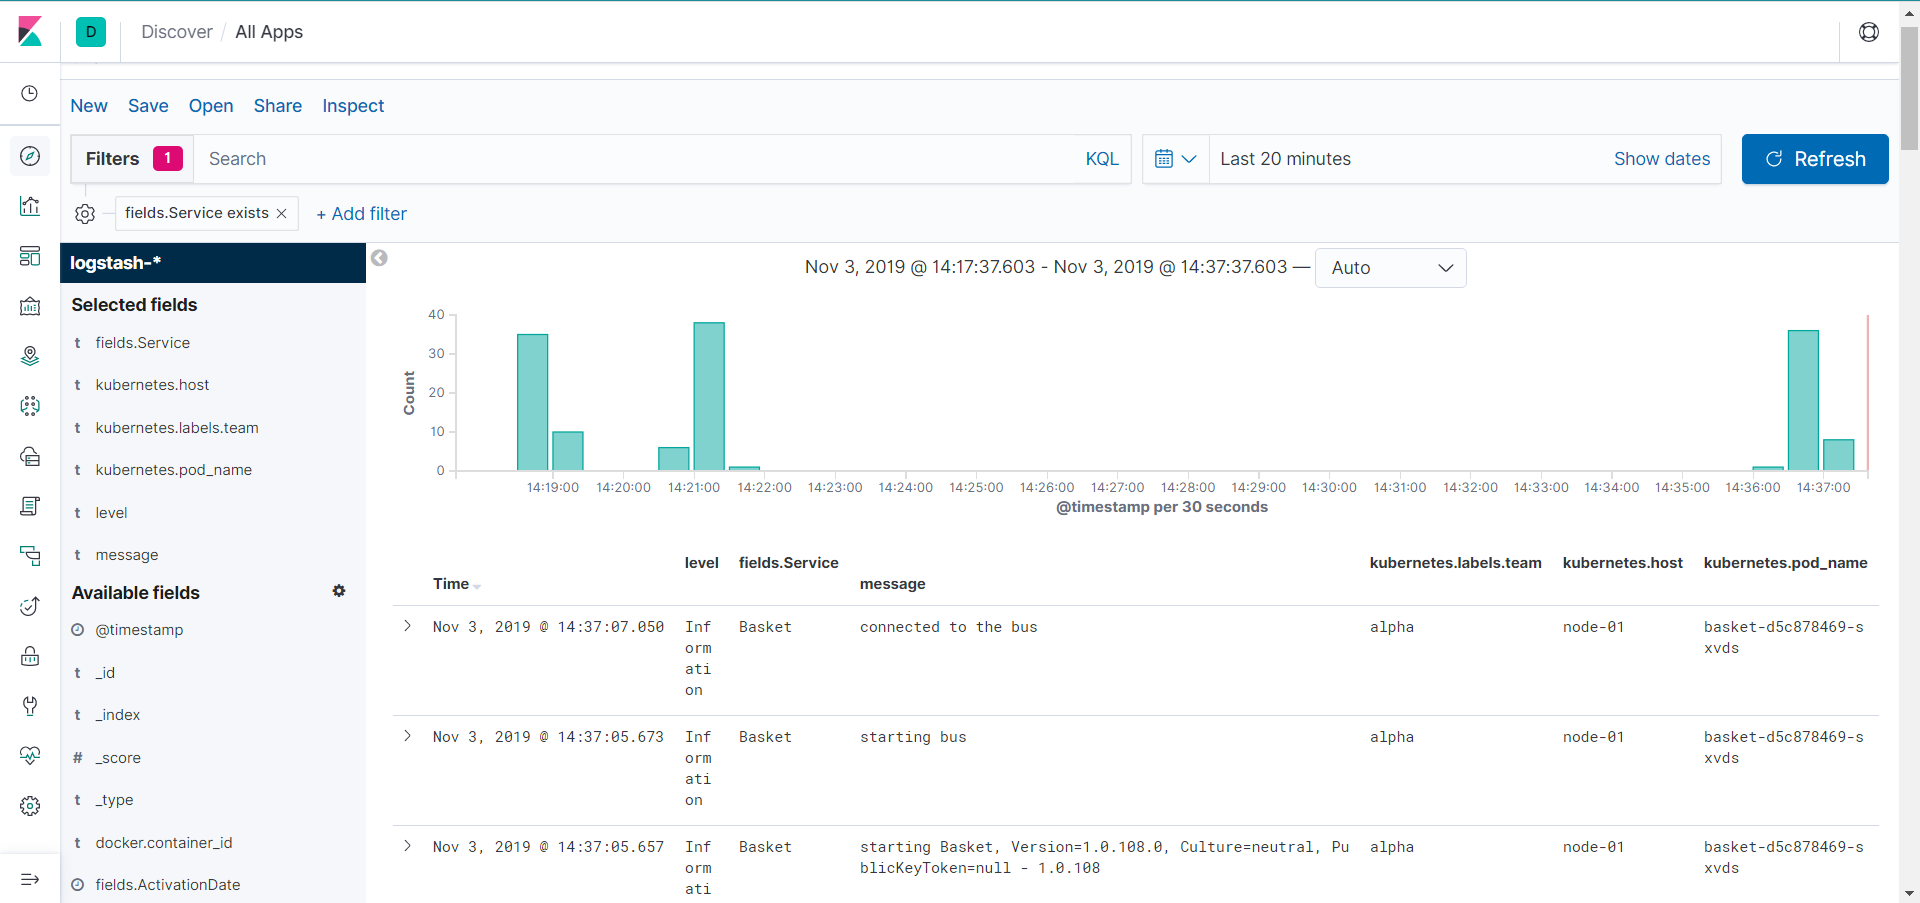
notes:
we have the following data (as columns)
- timestamp when the log was created (easy)
- Service name, we did this via the
.Enrich.WithProperty("Service", serviceName)line in our code - Level, its not logging without the level :)
- message, details of the log, this is what our FluentD filter ensured we extracted
- Team, this was from a K8s Label, allowing a team to filter for their services only
- Node and pod name, FluentD added this, and allows us to see if its a certian pod or host mis-behaving
the above are a great start for multiple teams running micro-services to see some details (if we combine this with good metics and tracing then we are onto a winner)
Conclusion
The above sample is a simple setup of FluentD, it will get you started with using a log-shipper that can decouple your architecture from the central logging component (we can ship these logs anywhere we want now)